

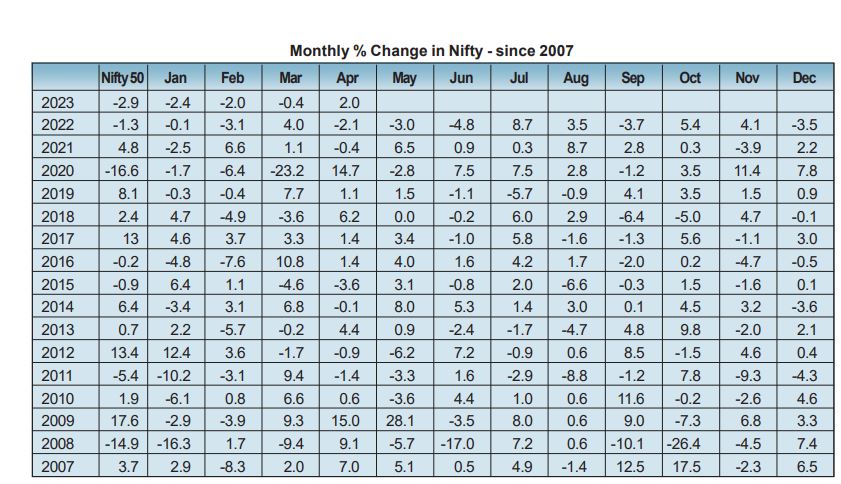
If you are looking for a reason to sell, then you are in luck. Look no further. It is time. Historical evidence points to better returns in a six-month cycle from October through April and staying away from investments in the next six months starting May. And hence the adage: “Sell in May and go away”.
If that is the case, why do investors persist with investments beyond April? Is that due to mistrust in statistics? Perhaps. Or is it the urge to outsmart statistics, or just being a passive investor not wanting to disturb set patterns, or just letting the ongoing SIPs go uninterrupted to benefit from compounding toward long-term wealth? Then there is the recent evidence of 2020, which gave once-in-a-lifetimeme returns during the period after March.
In the last issue, I had written about why we should be expecting short covering rallies in April. The set up for the same was built on extreme short positions accumulated by FPIs in the index future segment over a long period of time with earnings and seasonally bright April providing the ideal fuel and positivity to trigger the covering. Evidently, the anticipated uptrend unfolded but was seen facing headwinds towards the end of April, having run almost 1000 points since late March. Let us now look at the backdrop in which we would be entering May 2023.
Has FPI’s short covering ended?
From a year high of 92.2%, FPI’s shorts now constitute a tad under 40% of their index future positions. So, significant covering has already happened. However, in comparison with other participants, FPI’s shorts in the index future segment constitute nearly 26% of the total OI in the segment, while longs constitute only a bit under 17%, suggesting that FPI’s index future shorts continue to be in a trend influencing proportion.
Earnings
The early bird results for the January-March quarter of 2022-23 (Q4FY23) show a pick-up in earnings growth, despite a slowdown in revenue growth, thanks a decline in input costs and lower provisioning for bad longs by banks. The combined net profit of 66 companies that have, so far, declared their quarterly results were up 15.2 percent year-on-year (YoY) in Q4FY23 an improvement from 4.3 percent YoY growth in Q3*. So, we have a positive platform laid in terms of earnings numbers, and with 44 out of Nifty 50 stocks yet to release numbers, there is a lot to look forward to.
Volatility
This would be the key driver in May since we would be entering the month with April seeing a systematic decline in VIX and trading ranges. Should VIX rise in May, something that is to be expected given sub 12 levels seen in late April, we would see May in red. However, we would like to draw comparisons with 2017 where in VIX was seen declining in the first few months of the year, followed by sub 12 levels persisting for several months after.
This is how we are prepared to start May with, as a base case scenario, given historical data: Low volatility, with moderate gains.
Reference: *www.business-standard.com