

Directional cues from F&O segment
Among the various assets available for a futures and options trader, the most preferred segment is that of the index option. They have depth, variety, and margin benefits, as well as liquidity across contracts, all of which facilitates naked trades, multi leg trades, Greek-based trades and is a haven for jobbers as well as event-based traders. Meanwhile, stock options and stock futures are focussed plays. No wonder, volumes in the F&O segment are rising month after month, albeit at the expense of cash market. But, while index options remain the favourite for trading purpose, those digging into data to draw directional insights are often left wanting more. This is where index futures step in, as it is usually used as a hedge or for one side plays. Directional cues are hence sought for, by analysing participant-wise data published by NSE. There are four participants namely, FIIs, DIIs, Pro and Client.
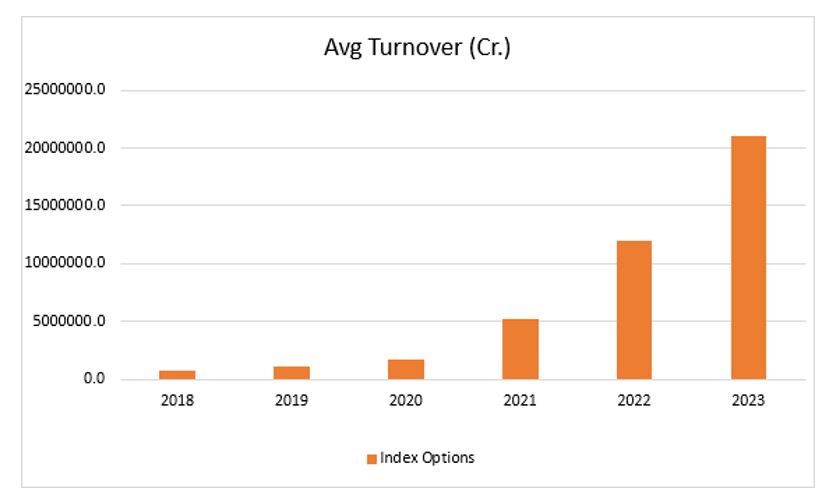
There has been phenomenal growth in index options in terms of both popularity and turnover, over the years.
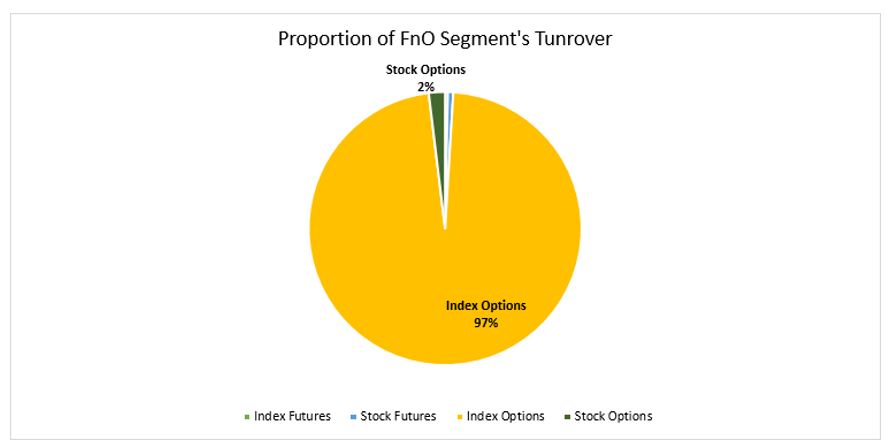
In terms of turnover, index options constitute the bulk of the F&O segment. A whopping 97% as of March 2023!
Where to look
Of the four participants, FIIs and clients are the most significant in terms of the volumes they generate. By the end of the third week of March, 60% of index future positions were held by clients, while FIIs, Pro and DIIs held 21%, 9%and 9% respectively. This data shows that FIIs are only second when it comes to volumes in the index future segment, and that to a far second. And yet, FIIs are considered the most important in terms of understanding directional cues because FIIs are few in number when compared to clients and FII’s actions are more focussed than that of clients. Hence, apart from looking at daily institutional flows in and out of equity market, participant wise data is a carefully analysed piece of information on a daily basis.
Making sense of participant-wise data
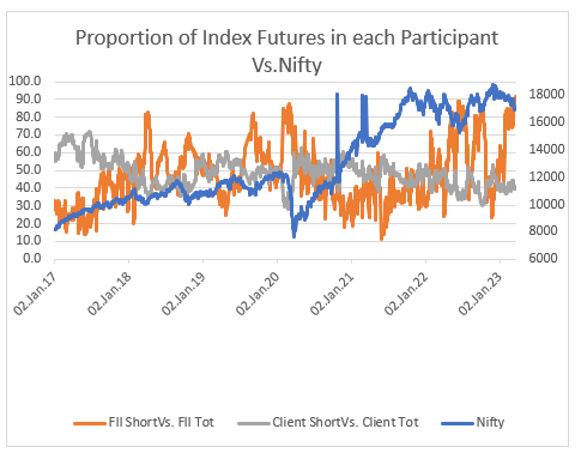
Though clients hold almost three times as much as positions as FIIs, the manner in which they accumulate or liquidate in response to Nifty’s swings is vastly different from that of FIIs. And this gives a precious angle to look at. This difference between client and FIIs manifests in terms how often the concentration of shorts move from one extreme to other. Whereas clients’ percentage holding of shorts in the index future segment varied in a narrow range of 30 to 60, FIIs’ holding of index future shorts swung between 10 to 90. But more importantly, Nifty had a higher correlation to FII’s index future positions than that of clients. Further, as FIIs’ short position rose to 60 and above, or dipped to 30 or more, the correlation with Nifty improved. In other words, FII positions appeared to show characteristics of an oscillator, with extremes of FII short positions indicating potential reversal in Nifty. Such relationship was not visible between Nifty and client’s short positions.
Brace for major upsides in April
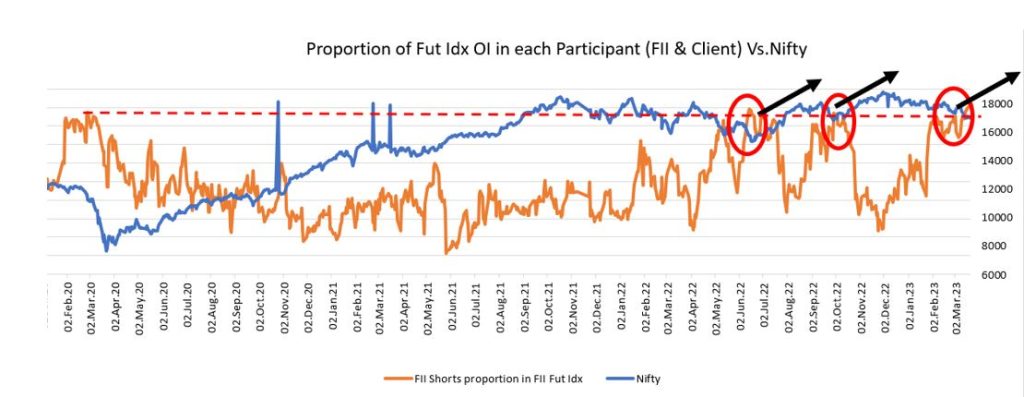
Though the FII positions appeared to show characteristics of an oscillator, it was not evident throughout. But the correlation between FII short position’s proportion and Nifty rose to -0.7, indicating strong negative correlation, whenever the FII short positions went above 60. In other words, whenever the FII short positions in index futures go above 60%, the correlation (negative) starts strengthening. This is year so far, the first instance of the short positions going above 80% was 30th January, which was followed by about 500 points rise in Nifty. The second instance was on 23rd February, post which around 300-point rise in Nifty was seen. Since 10th March, short positions of FIIs in index futures have stayed above 80%. Incidentally FII index short positions are now above 90%, which warrants a reversal, and consequent upside in Nifty, especially as the extreme positioning have been on for almost all through this year so far.
Downside risks
| IndexFUT | ||
| Avg Turnover | Proportion | |
| 2023 | 38725.3 | 0.2 |
| 2022 | 39568.8 | 0.3 |
| 2021 | 33274.1 | 0.6 |
| 2020 | 33710.6 | 1.7 |
| 2019 | 24538.3 | 1.9 |
| 2018 | 23549.2 | 2.6 |
| 2017 | 17309.7 | 2.9 |
Proportion of Index Future in F&O segment has dwindled despite its turnover going up. This is due to rising popularity of index options which constituted 97% of F&O turnover as of March 2023.
No predictions come with a guarantee. The upside view for April, predicted on the basis of an expecting a short covering by FIIs, which in turn could lead to Nifty higher, faces challenge from the fact that, over the years, the proportion of index futures in the F&O segment has dwindled from 2.9% in 2017 to just 0.2% presently. In other words, even if the short covering unfolds on anticipated lines, there is a risk that such short covering may not be meaningful enough to cause a rise in Nifty. There is also a chance that index futures are not concentrated enough in the near month to cause a hurried covering, but in turn are spread across contracts, especially the next month expiry. Despite these two caveats, there is no mistaking the fact that FIIs’ shorts in index future shorts are at unprecedented level, and that they are most likely to be eased before the second week of April, which is a seasonally good month for equity markets.