
Indian stock market overtook Hong Kong as the fourth largest in the world, inflation worries ease, clouds of geopolitical tensions are less thorny, Fed poised to cut rates…Equity markets have rarely had such a perfect setting at the start of a year, even while being at record peaks. Investors have become more mature, a persistence in SIPs ensuring a steady flow of money into the equity market, while also snuffing out several attempts to collapse, or to raise volatility. Let us look at some aspects beyond the usual fundamental or quantitative aspects, to see how well the investors have been reading these signals.
Demat accounts rise
The increasing number of client accounts in both CDSL and NSDL serves as a key indicator of the growing interest in investment and trading activities among the Indian population (Table 1). The attractive returns from equity markets, digitalization, an easy account opening process, and increased financial literacy contribute to this phenomenon. The increasing number of client accounts aligns with a corresponding surge in equity turnover, indicating a growing interest and participation in the equity market.
Table 1. Number of client accounts in CDSL and NSDL
| Year | Total No. of Client Accounts (in Cr) | % change |
| 2023 | 13.6 | 26 |
| 2022 | 10.7 | 35 |
| 2021 | 8.0 | 63 |
| 2020 | 4.9 | 27 |
| 2019 | 3.9 | 13 |
| 2018 | 3.41 | 13 |
| 2017 | 3.03 | 14 |
| 2016 | 2.66 | 9 |
Source: cdslindia.com, nsdl.co.in, Geojit Research
Equity turnover not so much
The substantial growth in equity turnover in both NSE and BSE underscores the escalating trading activities in the equity market (Table 2). This positive trend, with occasional fluctuations, reflects a robust interest in equity investments. The turnover in equity, however, represents only a marginal growth when compared to that of derivatives. Average trade size went up around 3% compared to previous year, while average number of securities traded increased 11% (Table 3).
Table 2. Equity Turnover in NSE and BSE
| Year | Total EQ Turnover (in Cr) | % change |
| 2023 | 1,75,87,721 | 16 |
| 2022 | 1,52,10,805 | -18 |
| 2021 | 1,85,87,312 | 29 |
| 2020 | 1,44,14,789 | 59 |
| 2019 | 90,53,163 | 2 |
| 2018 | 88,61,272 | 13 |
| 2017 | 78,45,627 | 44 |
| 2016 | 54,31,501 | 6 |
Source: nseindia.com, bseindia.com, Geojit Research
Table 3. Average No. of securities traded and Average Trade Size
| Year | No. of Sec Traded* | Trade Size* |
| 2023 | 3039 | 29149 |
| 2022 | 2732 | 28192 |
| 2021 | 2524 | 31605 |
| 2020 | 2422 | 31673 |
| 2019 | 2338 | 28801 |
| 2018 | 2227 | 28247 |
| 2017 | 2060 | 28522 |
| 2016 | 1877 | 24177 |
| 2015 | 1777 | 23380 |
*Average figures. Source: nseindia.com, Geojit Research
Derivatives outpace equities
VIX, a measure of volatility was closer to record low for a significant part of 2023, as opposed to being at record high levels in 2020. This in addition to popularity of the weekly index options, has meant a meteoric rise in interest in the option segment, so much so that NSE emerged as the world’s largest derivative exchange in terms of contracts traded in 2023. The proportion of Index Options has been increasing over the years so much so that it forms 98.5% of derivatives turnover, as opposed to just under 75% in 2015 (Table 5).
Table 4. NSE Derivatives Turnover
| Year | Derivatives Turnover (in crore) | |||||||
| Index Futures | % change | Stock Futures | % change | Index Options | % change | Stock Options | % change | |
| 2023 | 74,45,051 | -24 | 2,15,30,867 | 9 | 6,75,58,12,206 | 127 | 7,71,47,704 | 31 |
| 2022 | 98,13,071 | 19 | 1,97,49,313 | -7 | 2,97,79,53,161 | 132 | 5,88,43,505 | 13 |
| 2021 | 82,51,970 | -3 | 2,12,25,472 | 28 | 1,28,43,18,836 | 188 | 5,21,15,505 | 162 |
| 2020 | 84,95,076 | 42 | 1,65,83,570 | 13 | 44,56,41,593 | 61 | 1,98,63,767 | 64 |
| 2019 | 59,88,111 | 3 | 1,46,20,466 | -13 | 27,65,14,775 | 46 | 1,21,38,024 | 1 |
| 2018 | 57,93,097 | 35 | 1,67,61,940 | 15 | 18,96,58,405 | 64 | 1,20,46,118 | 37 |
| 2017 | 42,95,655 | -4 | 1,45,47,864 | 46 | 11,54,77,118 | 77 | 87,95,112 | 65 |
| 2016 | 44,92,381 | -4 | 99,59,886 | 25 | 6,53,47,015 | 38 | 53,29,414 | 61 |
Source: nseindia.com, Geojit Research
Table 5. Proportion in Total Derivative Turnover
| Year | Index Futures | Stock Futures | Index Options | Stock Options |
| 2023 | 0.001 | 0.003 | 0.985 | 0.011 |
| 2022 | 0.003 | 0.006 | 0.971 | 0.019 |
| 2021 | 0.006 | 0.016 | 0.940 | 0.038 |
| 2020 | 0.017 | 0.034 | 0.908 | 0.040 |
| 2019 | 0.019 | 0.047 | 0.894 | 0.039 |
| 2018 | 0.026 | 0.075 | 0.846 | 0.054 |
| 2017 | 0.030 | 0.102 | 0.807 | 0.061 |
| 2016 | 0.053 | 0.117 | 0.768 | 0.063 |
| 2015 | 0.074 | 0.126 | 0.748 | 0.053 |
Source: nseindia.com, Geojit Research
IPOs sizzle
The data on Initial Public Offerings (IPOs) in India reveals a robust primary market with a rising trend in the number of IPOs, reaching a peak in 2023 with 58 mainline offerings, even though the total amount raised was far below the record amount seen in 2021. That said, the main showstopper was the resurgence in SME IPOs which mopped up a whopping Rs 4,967 crore demonstrate a more consistent performance over the years.
Table.6 IPOs listed in India and Amount raised.
| Year | Mainline | SME | Total no of IPOs | Total amt raised (Rs cr) | ||
| Number of IPOs | Amount Raised (Rs Cr) | Number of IPOs | Amount Raised (Rs Cr) | |||
| 2023 | 58 | 49,437 | 182 | 4,967 | 240 | 54,404 |
| 2022 | 40 | 59,939 | 109 | 1,980 | 149 | 61,919 |
| 2021 | 63 | 1,19,882 | 59 | 787 | 122 | 1,20,669 |
| 2020 | 16 | 26,628 | 27 | 168 | 43 | 26,796 |
| 2019 | 16 | 12,687 | 54 | 657 | 70 | 13,344 |
| 2018 | 25 | 31,731 | 144 | 2,409 | 169 | 34,140 |
| 2017 | 38 | 75,279 | 135 | 1,738 | 173 | 77,017 |
| 2016 | 27 | 26,501 | 67 | 562 | 94 | 27,063 |
| 2015 | 21 | 13,513 | 43 | 275 | 64 | 13,788 |
Source: Chittorgarh.com, Geojit Research
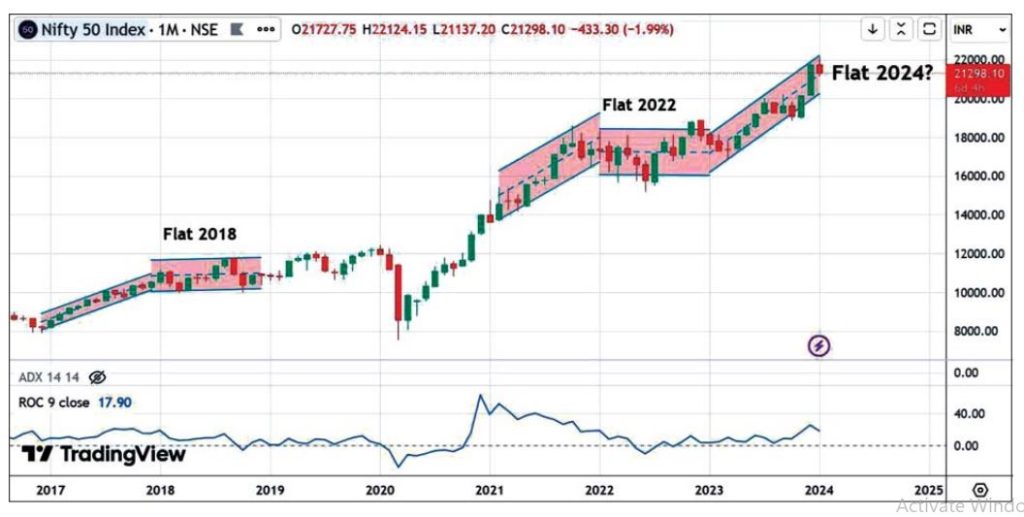
The year ahead
While the data reveals a very robust investment mood, one must not throw caution into the wind, as statistics usually conceal more than they reveal. Arguably, the rise in opportunities in the option segment may have helped the millennials and GenZ equity investors to remain interested in the capital market, and should, with time, mature into long-term investors. But it must be noted that 2023 has been an unusually low VIX year, and the deluge of elections scheduled in 2024 across globe, betrays a calm before the storm. Further, the data on IPOs suggest that for every year since 2015, that has seen a substantial rise in IPOs, the following year usually sees either a flattish year, or at least 50% of the months seeing negative returns.