

Technical Analysis is an art, if one were to use the example of having to decide on an arts or science stream, for your higher studies. An automatic choice for many at such a point is the arts stream, not as much due to the aptitude towards arts, as much as the disclination to learn science subjects. This allegory is not completely off, considering how Technical Analysis (TA) has become the go-to approach for many new traders now, because the visual approach to trading is easy to get introduced to. One gets to the science side of TA, only when the practitioner spends enough time using TA for analysis and putting it to practice. But most often, very few reach this stage due to a variety of reasons. It could either be because of disappointment of not finding positive results as often as one found during initial stages, or just because the investigative approach requires loads of patience as well as adeptness with analytical tools and software along with a knowledge of statistics.
This thought struck me when I was tinkering with Bollinger band settings while looking for stocks to pick up. For those new to Bollinger band, it is used to project how high or how low the price could move, based on the recent trend. The upper band is placed two standard deviations above the price’s 20-day simple moving average, while the lower band is placed two standard deviation below the price’s 20 day simple moving average. The end result has two lines following prices at a distance above and below the price, which appears like an envelope, while the middle line follows the price closely. The straightforward use for the analyst is to get potential upside and downside targets for price. And of course, one can play around with the moving average periods or standard deviations depending on your requirements.
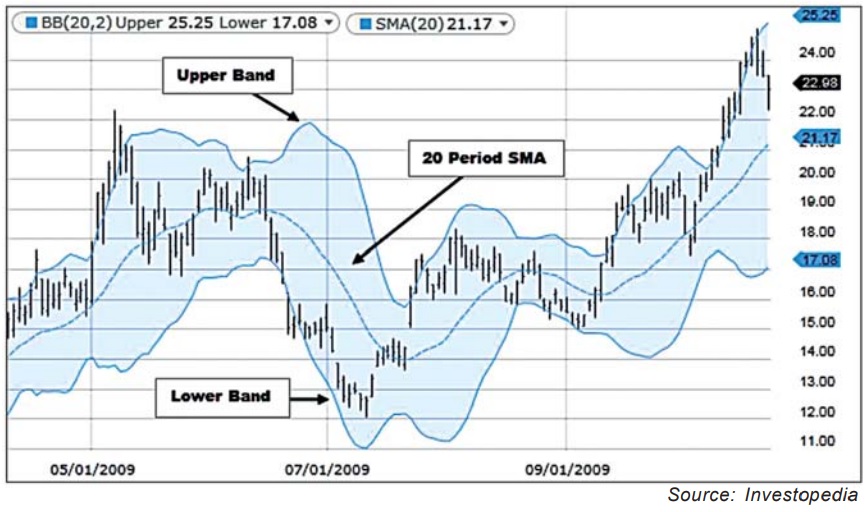
Once you get used to the bands as a potential range for the price, you would want to take your game to the next level and pick a side or an action, when the price reaches such bands. In other words, from the experience of how price performs when the price reaches these bands, exits or fresh positions may be initiated. A straightforward approach is to buy if the price closes below Bollinger band or sell if the price closes above the Bollinger band. I have found this to be fairly successful. And of course, all setups require further confirmations from other signals as well to act on the primary signal, but the success from a Bollinger band setup has been fairly straightforward. You may stop here and try out the success of Bollinger band setups, but if you have the penchant to dabble into a bit of descriptive statistics to fine-tune this setup, read on.
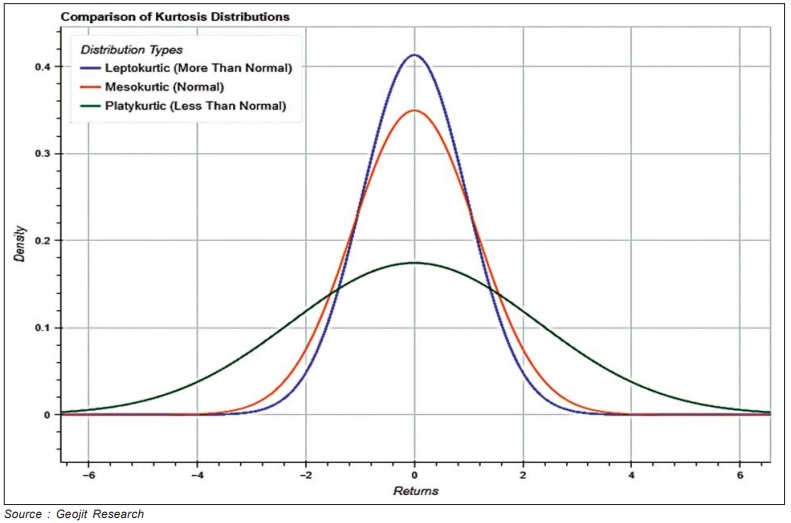
Would there be an ideal condition which facilitates the Bollinger band set up to throw up better signals. One way is to look for the extent of outliers in the price prior to the Bollinger band trigger, that shall improve the prospects of reversals. This is where Kurtosis comes in. Kurtosis tells us about the extent of outliers in our data. And for us, the more the prospects of outliers, the better. For this, we plot normal distribution of the stock prices in question and look for how steep the curve is. Of the three scenarios (flat, normal or peaked), we look for the peaked one, which is also called leptokurtic distribution which has a kurtosis value of more than 3.
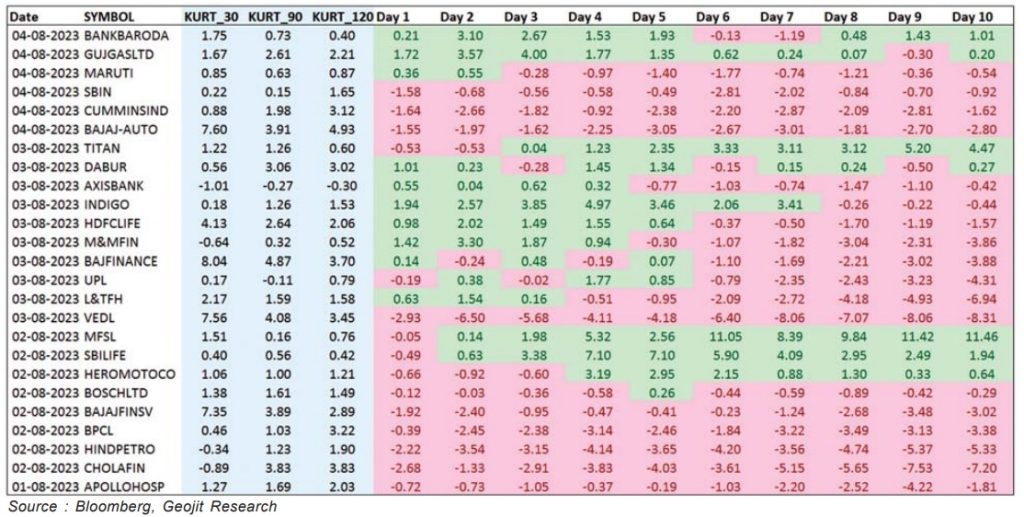
To see how much of an influence Kurtosis has on Bollinger band based anlaysis, we pulled up data of August, which was a difficult month for upsides, and found that Bollinger band set up found only 28% success. Then we calculated the Kurtosis of those stocks that had a 10 day history after Bollinger band trigger and removed those stocks which showed a Kurtosis of more than 3 in either 30 day, 90 day or 120 day look back period. This improved the success to 50%. If we include those stocks that only small negative figures, the success rate improves to 68%, assuming that the small negative figures may turn to positive figures post the 10 day period. Unfortunately, we did not have the data set to verify that leg. The idea behind leaving out those stocks with Kurtosis above 3 is that stock returns are generally expected to be leptokurtic, and thus expected to be outliers. Thus, by selecting the non lepto ones, we stand a better chance of the stock continuing oscillation between either ranges of the Bollinger band.
The outcome is likely to change as a bigger universe gets tested or more conditions are brought in, but the attempt here was to follow an investigative process. Such investigations have become part of modern technical analysis now. And with devices and analytical tools now easily available and accessible, the complexities of all these analyses will soon fade away, the only challenges that remain will be patience and a desire to learn. But aren’t they the challenges everywhere, always?