

Volatility means different things to different investors. A long-term investor sees high volatility as a signal to keep away from further investments due to lack of directional clarity. He/she is also highly likely to perceive rising volatility as a signal towards a market fall. On the other hand, high volatility suits a swing trader or a naked option trader as he/she gets a bigger trading range to play. Meanwhile, an option seller likes being in a declining volatility environment, as premium decline will be faster. In other words, while volatility impacts different people differently, there is no mistaking the fact that all stand to benefit, if they were getting a handle on volatility, as it paints a fair picture of market’s fear.
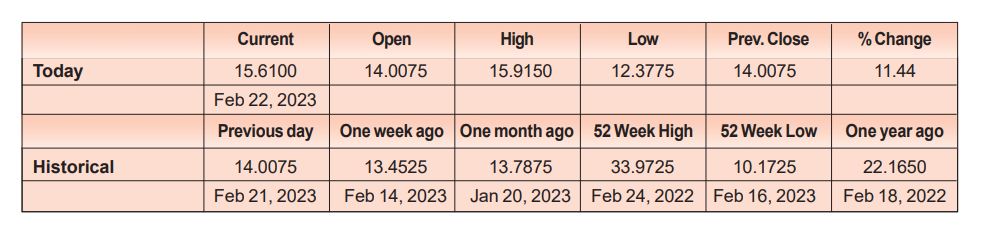
A popular indicator towards volatility used in the Indian market is VIX, which gives an idea regarding the expected volatility in the next 30 days. You can see below, how volatility expectations went up 11.44% on the expiry eve, anticipating uncertainty on the expiry day. A month ago, VIX was lesser, despite Nifty being higher at 18027, which suggests that traders were more comfortable with Nifty prices higher than present level. This shows that VIX is not a slave of price, but more of a sentiment indicator, and is hence in fact a leading indicator, and in this case suggestive towards more falls.
Put Call Ratio
PCR or Put Call Ratio brings in another dimension to the study of volatility by giving an estimate as to whether the present price move is at an extreme. PCR is simply the ratio of traded number of put and call options of the underlying. The ratio is more than one if more puts are being traded, hinting at bearish expectations. Alternatively, PCR less than one suggests that more calls are being traded hinting at bullish expectations. Now, this being the default understanding of PCR, traders look at extremes of these levels to make a trade. For example, some traders see PCR under 0.7 or so as an indication towards near term reversal, sensing a bearish exhaustion. In another variation to the use of PCR, some traders exclude far OTMs (Out of the Money) from both puts and calls from the analysis, as these strikes are used as a hedge by option sellers, or for reasons other than directional plays, making it sensible to avoid taking those strikes into consideration.
A chart plotted with the IV (implied volatility) of options against respective strike of Nifty is provided below. Usually ATM options have lower volatility, which increases as one goes far from the centre strike. In other words, OTM strikes are generally more volatile. The result shape of the graph resembles a smile, and hence a perfect IV smile is obtained if IVs are similar as we go further out along both puts as well as calls.
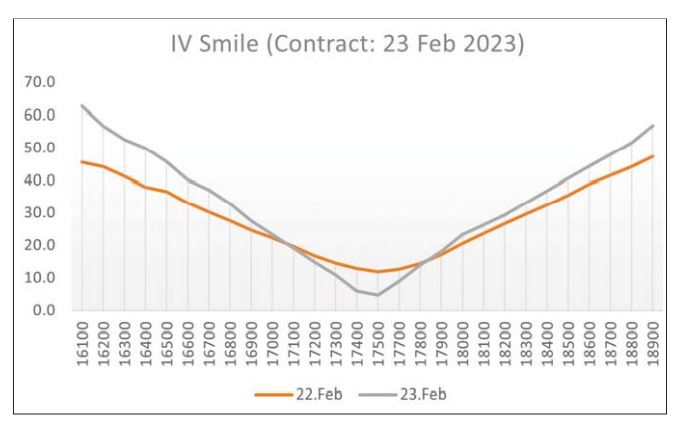
However, the angle that we are looking for is prospects of reversal or extremes, or even biases, which is obtained when the OTMs of puts are more volatile than calls or vice versa. The resultant shape is called a smirk. Just as a smirk indicates a prejudice, a volatility smirk indicates a bias by the traders. Both smile as well as smirk patterns of IV chart have two variations. If the U shape of the smile gets flattened, then it indicates that OTMs are seeing less volatility, pointing to trader’s comfort at present levels, and a moderate positive bias. On the other hand, if the smile is seen steepening, then it is pointing towards uncertainty and bigger ranges, and potentially a consolidation or a downside move. Meanwhile, a left smirk points to higher demand for put buying, suggesting strong downsides, while right smirk points to a higher demand for call buying, thereby suggesting strong upsides.