
Consumer sentiments corrected by 2.6 percent during the last two months of 2022. In the preceding two months, September and October 2022, sentiments had improved by 13.6 percent. The impressive improvement in sentiments during September and October 2022 reflects the festival season effect in India. A post-festival season correction was expected. It is interesting to note that the correction was small compared to the gains in sentiments during the season. On a net basis, consumer sentiments seem to have gained by over 10.7 percent since the festive season in India.
Sentiments continue to improve in January. By 22 January 2023, the 30-day moving average of the Index of Consumer Sentiments (ICS) was 2.2 percent higher than it was at the end of December.
The sustained improvement in the ICS implies that the 2.6 percent fall it registered during November and December 2022 was essentially a temporary phenomenon that can be attributed to the seasonal nature of the work of daily wage labourers and small traders.
Prospects of a seasonal increase in business by small traders and increase in demand for daily wage labourers could have raised their sentiments during the build-up to the festive season. As the festive season wanes, this demand recedes and at least a part of their gains in sentiments are shed.
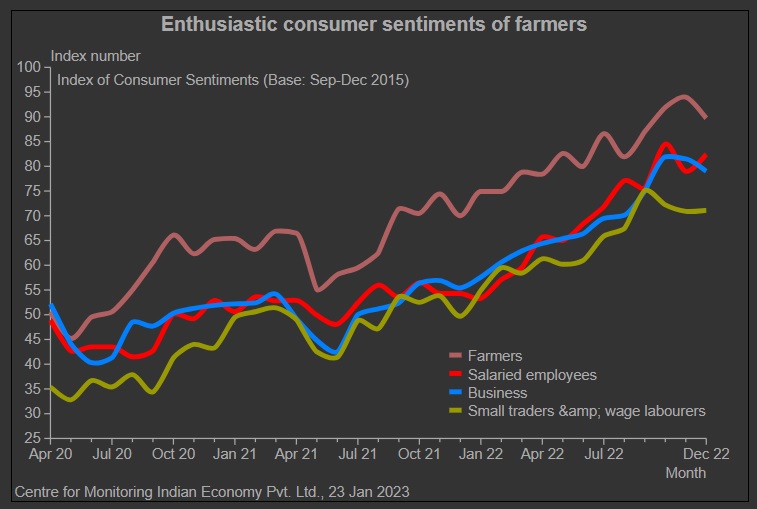
Small traders and daily wage labourers had recorded a sharp 22 percent increase in their ICS between June and September 2022. This is the period when the demand for daily wage labourers increases on the farms and also in preparation for the ensuing festival season. While the sentiments of all other occupation groups also improved, it was the daily wage labourers that saw the biggest jump. Overall, the ICS increased by 13.7 percent between June and September 2022.
Then, between September and December 2022, the ICS for daily wage labourers shrunk by 5.4 percent. All other groups saw a continuation of the growth in the ICS during this period. Evidently, the cumulative post festive season correction is limited to the daily wage labourers group. Small traders and daily wage labourers account for about 18 percent of the total income generated by all households. But they account for a larger 25 percent of all households.
Between September and December 2022, the ICS for salaried employees grew by a handsome 8.9 percent. This is the group that has the highest average income levels. It is significant in size as well although it is not the largest group in terms of count. The importance of the salaried class is its greater average income and also its share in total income of all households. Among the four major occupation groupings businesspersons, salaried employees, daily wagers and farmers, it is the salaried class that generates the highest income.
There are about 60.5 million households of the salaried employee class. They account for about 18 percent of all households in India. But these 18 percent households account for 27 percent of all the incomes earned by households in India. From the perspective of future growth potency of a group, the sustained elevated consumer sentiments of the salaried class have greater salience. Interestingly, the salaried class has demonstrated greater optimism on the future. The Index of Consumer Expectations (ICE) for this group has risen by over 12 percent between September and December 2022 while the overall ICE grew by a much smaller, five percent.
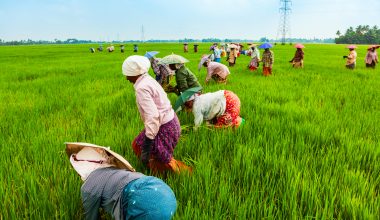
From a growth-potency perspective, farmer households are equally important. They account for 26 percent of all households and 25 percent of all household incomes. What is remarkable about this group is its sustained elevated ICS compared to all other household groups. In April 2020, when the pandemic hit Indian households, the ICS for farmer-households was almost the same as for business households and just a shade above the ICS for salaried employees. But farmer-households have shown a much smarter recovery since the early 2020s. The ICS for farmer-households has been consistently higher than all other household groups throughout the post-April 2020 period.
As of December 2022, the ICS for farmer-households was 11.5 percent higher than the average ICS. Earlier, in November 2022 it was 15.7 percent higher.
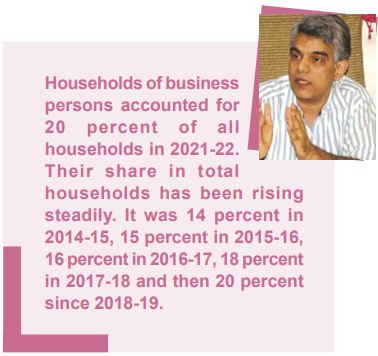
Households of businesspersons accounted for 20 percent of all households in 2021-22. Their share in total households has been rising steadily. It was 14 percent in 2014-15, 15 percent in 2015-16, 16 percent in 2016-17, 18 percent in 2017-18 and then 20 percent since 2018-19.
The share of these households in total household income, however, has not grown similarly. They accounted for 19 percent of the total household incomes in 2014-15. This grew to 20 percent in 2016-17 and then to 24 percent in 2018-19. Since then, it has declined to 20 percent.
The ICS of business households remains a shade below and tracks, very closely, movements in the overall ICS. In November 2022, for the first time in over two years, the ICS for businesspersons jumped over the overall ICS. But it could not sustain that in December.
Households of salaried employees and of farmers, who collectively account for about 45 percent of all households and 52 percent of the total household incomes, seem to be sustaining the growth in consumer sentiments.
First published in Business Standard.