

Listed companies made extraordinary profits in the quarter ended March 2021. As of June 17, of about 4,400 listed companies that usually release their financial statements at the end of a quarter, 1,705 companies had published their statements for the quarter ended March 2021. These companies raked in a net profit of Rs.1.9 trillion. This is much higher than the record Rs.1.5 trillion net profit generated by the full set of companies in the preceding two quarters.
The pertinent question that arises next is: what have companies done with the super profits they generated in 2020-21? A partial answer to that question is available in the balance sheet presented by listed companies every six months. We studied the balance sheet data available for 1,326 non-finance companies. Usually, around 3,100 non-finance companies release their balance sheet as of every March and September. Two inferences can be drawn from the balance sheet data of non-finance companies as of March 31, 2021.
First, it is evident that non-finance companies de-leveraged by the end of this bountiful year. The debt:equity ratio of listed companies is significantly lower than unlisted companies. While the ratio for all companies including listed and unlisted companies, as evident from the Annual Reports, has been in the range of 1 to1.1 in the five years till 2019-20, that of listed companies as seen from their interim financial statements has been in the range of 0.5 to 0.6 with an average of 0.54.
Initially in the pandemic times, listed companies showed an increase in their gearing ratio. It had risen to 0.62 as of March 2020. It then came down to 0.56 as of September 2020. Apparently, the superlative profits during the quarter helped rein in the ratio. By the end of March 2021, the ratio was down to 0.41. This is a big fall. It is the lowest gearing ratio in at least the last 11 years since when such data is available.
A related ratio tells us the same story. Outstanding borrowings of listed non-finance companies declined by a substantial 9.3 per cent as of March 2021 compared to March 2020. This is the first time that listed companies registered a fall in outstanding borrowings since September 2010. The fall in outstanding borrowings seen in company financial statements squares with RBI data on credit disbursals. It shows that the outstanding loans to large companies as of March 2021 were 0.8 per cent lower than they were a year ago.
Borrowing has declined and even current liabilities and provisions have been reined in. As of September 2020, current liabilities and provisions were lower than they were a year ago. By March 2021, these were up by a whisker compared to a year ago, by just 2.6 per cent.
The second big takeaway from the balance sheet of non-finance companies is that they are not enthusiastic about deploying their profits into expansion of capacities. In spite of profits growing by a robust 48.5 per cent in 2020-21, companies grew their net fixed assets by a measly 3.7 per cent at the year ended March 20201. The average year-on-year growth in net fixed assets since March 2017 has been close to 10 per cent. The fall was perceptible at 5.9 per cent as of September 2020 and then again in March 2021 at 3.7 per cent.
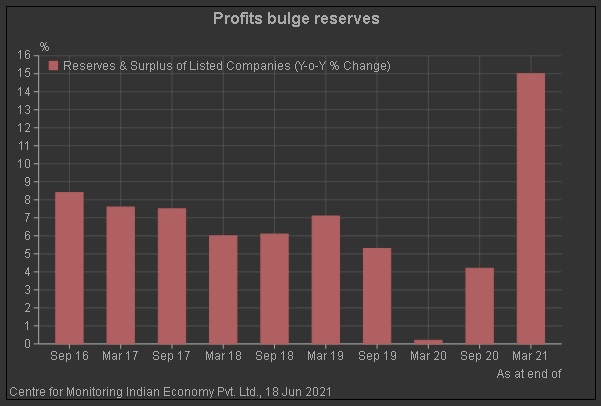
Company financial statements tell us a factual story of what company honchos are thinking and doing with their resources. It seems they used the profits to reduce their outstanding borrowing and other liabilities. They strengthened their balance sheets by reducing debt and fortifying reserves. Reserves and surplus of these non-finance companies expanded 15 per cent over the year as of March 2021. This is the highest yearly jump in reserves in the last decade.
Companies had good reason to take avoid channelling their bountiful profits of the year into creation of new assets. They already had an overload of underutilised capacity. As of September 2020, the net fixed asset utilisation ratio was 1.29 when the average of the preceding decade was 2. The ratio had been falling consistently from 2.11 as of September 2018. It made sense for them to roll back on further expansion of assets. This helped in bringing the asset utilisation ratio back to its average of 2 as of March 2021.
Companies went slow on financial investments as well. These grew by 7.3 per cent marking a second consecutive year of a decline in the growth of investments.
The stashing of profits into reserves is clearly evident and this puts pressure on companies to deliver returns on them. It is possible that companies are keeping their powder dry for organic and inorganic growth when a recovery becomes clear. But, that is a mere conjecture till we explore more data of what the listed companies did with their extraordinary profits of 2020-21.