

Isn’t it strange how, over the past few years, the weather patterns have completely changed? We remember a time when, come October, the rain Gods would politely step aside for winter. Not anymore. Now it rains in October… sometimes even November.
But why are we talking about this? Because what you don’t know or don’t prepare for has a way of reminding you that ignorance is rarely bliss. We learnt that the hard way one late October while attending Enrique’s concert in Mumbai. Just before he came on stage, the skies opened up and the show was delayed by 90 minutes.
We couldn’t run, we couldn’t hide, nor could we escape the Mumbai rains.
The show eventually began, and spirits recovered. What followed was a simple hunt for a meal that turned into a lesson we didn’t know we needed. We ended up at a newly opened place in BKC, where the waiter confidently urged us to try the special of the day — Khow Suey. None of us had tried it before, so we surrendered.
Soon, each of us received a tray: one large bowl of coconut-based broth and noodles, surrounded by little bowls of chilli oil, fried garlic, crushed peanuts, and lime.
We looked at the bowl- then at each other- and finally at the waiter, who smiled and clarified that these were Build-Your-Own-Bowls. So, we began. Same ingredients, same broth but we mixed them in wildly different proportions. One went heavy on chilli oil, one drowned the lime, another emptied half the peanut bowl, and one of us—driven by a middle-class vasooli mentality—added everything—Ignorance again, we suppose.
And the results? Four bowls of the “same dish” tasted like four different cuisines. One fiery, one tangy, one oddly sweet, and mine… let’s call it a culinary apology. Add the appetisers and drinks — part of the meal, but not part of the Khow Suey — and it turned into quite an evening.
During feedback, the waiter said something interesting: “The base was the same. The outcome depends on what you put on top.”
At the time, it felt like a clever line. But a few days later, in a completely different setting, that sentence returned — not because we were thinking about food, but because it perfectly captured the mindset unfolding in front of us. We met an investor whose return expectations from equities, in our opinion, were rather elevated. When we asked how he arrived at his number, his logic was simple, confident, almost delivered as gospel:
“India’s GDP is growing at X%. So, equities should do at least 2x of that. Good companies always grow faster than the economy.”
To be fair, his expectations were shaped by his past experiences and hence it was in no-way out of whack. It wasn’t his number that surprised us, it was the certainty. The belief that because the base is strong, the outcome must automatically be stronger. That’s a form of innocent ignorance… but in markets, even innocent ignorance is not bliss.
Investors assume outcomes are predictable. They assume return = multiple of GDP growth (always, may be even linearly every year). But as we all learn sooner or later, markets don’t reward oversimplified assumptions.
In our opinion, yes, GDP growth and market returns are linked but not always in the way investors assume. The growth of a country is generally measured in terms of GDP. It’s a broad representation of how the country is doing. The market (broader Index) on the other hand is a representation of possibly the best listed companies in the country. Therefore, while as investors, we may broadly only look at the growth number both for the GDP and broader index, a more nuanced understanding is warranted.
So before accepting or rejecting the logic the GDP Growth leads to Market Growth, we decided to test it — not just in India, but across other major economies where GDP and market structures differ widely.
To have a better understanding of this we broadly need to first understand the elements of what drives the economy of a country and second elements of what drives the broader index of the country. These two live in the same country, but they don’t grow at the same speed, and they need not always have a positive correlation.
So, let’s begin with testing the hypothesis across countries. (Exhibit 1)
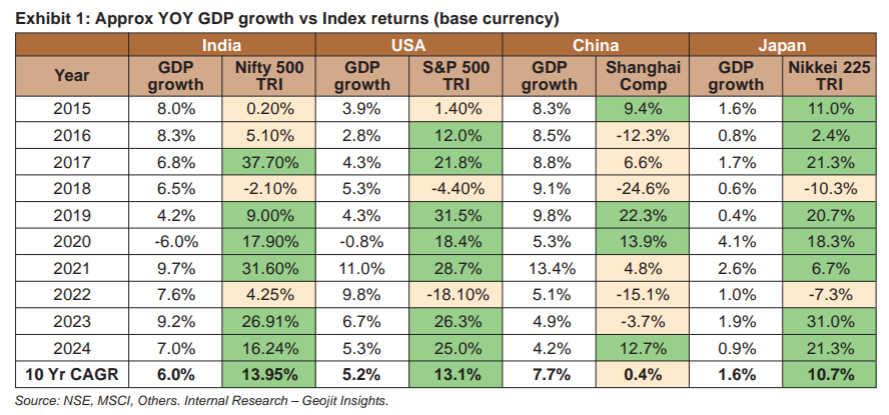
When we line up the last decade across India, the US, China and Japan, the story becomes a lot more interesting. India more or less behaves the way most investors expect it to; a reasonably strong economy and a market that has managed to do even better. The US, oddly enough, extends that logic by some miles. Its economy has grown slowly, but its market has raced ahead defying most people.
China, however, flips the script completely. On paper, its economic growth has been impressive for years. In reality, its market hasn’t gone anywhere.
And then there’s Japan — the quiet surprise. The economy hasn’t grown much, but the market has quietly rebuilt itself through reforms, better governance, and steady buybacks. The result is far better than most people realise. But this has come after almost 30 yrs of no returns.
Clearly, the idea that GDP growth must translate into equivalent market returns doesn’t hold up everywhere. To be fair, the idea that market returns outpace GDP growth has broadly played out in India over long cycles, and it may continue to do so. But it shouldn’t be taken as a given. These relationships hold meaning only when viewed over decades, not the 1–3–5-year windows we instinctively default to when it comes to equities. So rather than stop here, we felt it was important to go one layer deeper.
Percentages alone can deceive without context. To really understand the disconnect between GDP and markets, we need to look at what each economy is made of — and more importantly, what each index is made of.
- Firstly, the size of the economy matters. Among the countries mentioned, the US economy stands tall with a GDP of USD 29.3 trillion followed by China with USD 18.74 trillion. Japan and India come in at the bottom with USD 4.3 trillion and USD 3.9 trillion, respectively. It takes no mathematical genius to figure out that given the size, large economies will find it slower to grow. But having said that, even small % increases can be quite substantial in absolute growth.
- Secondly, the construct of an economy and the corresponding Index of the country can be quite different.
GDP sectors and index sectors don’t perfectly overlap, but this grouping gives a reasonable picture of where the economy’s weight lies versus where the market’s weight lies.
In India, as a broader allocation, Services make up 55% of the GDP, followed by Industries- 25% and Agriculture with 18%. We break this down further. (Exhibit 2)
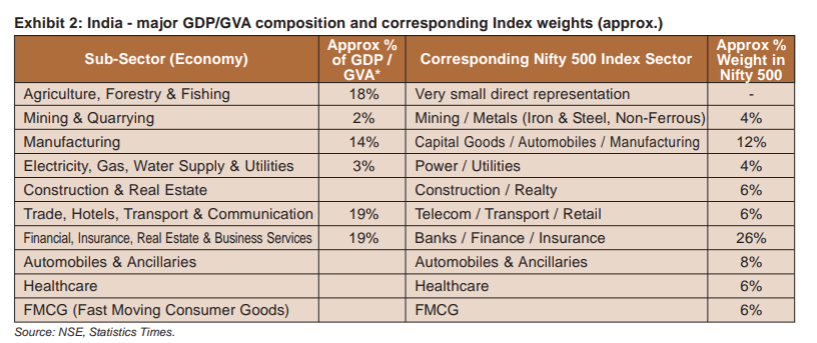
India’s GDP is heavily services-led, but the Nifty 500 is dominated by financials and under-represents agriculture and several unlisted service sectors. In fact, iconic contributors to India’s economy from Amul to Britannia to thousands of SMEs are either unlisted or underrepresented, and therefore invisible in the index.
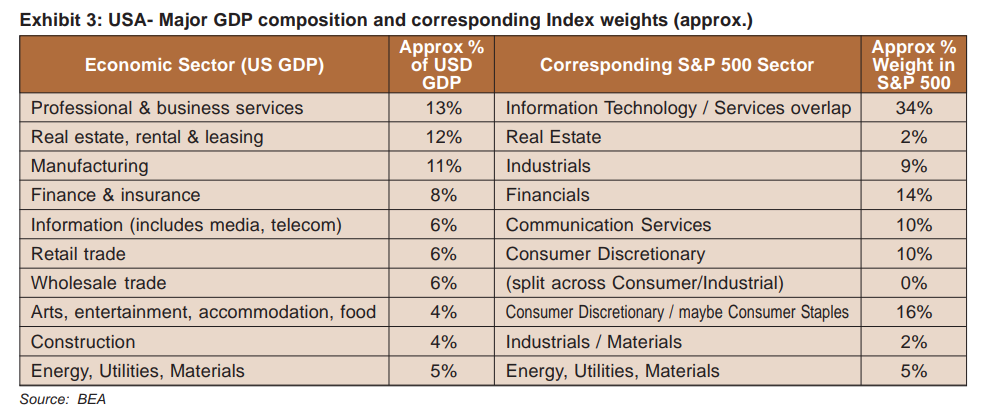
Clearly the S&P 500 Index is more biased towards the tech sectors which are light on asset but heavy in R&D, Tech designing, IP and Patents. (Exhibit 3)
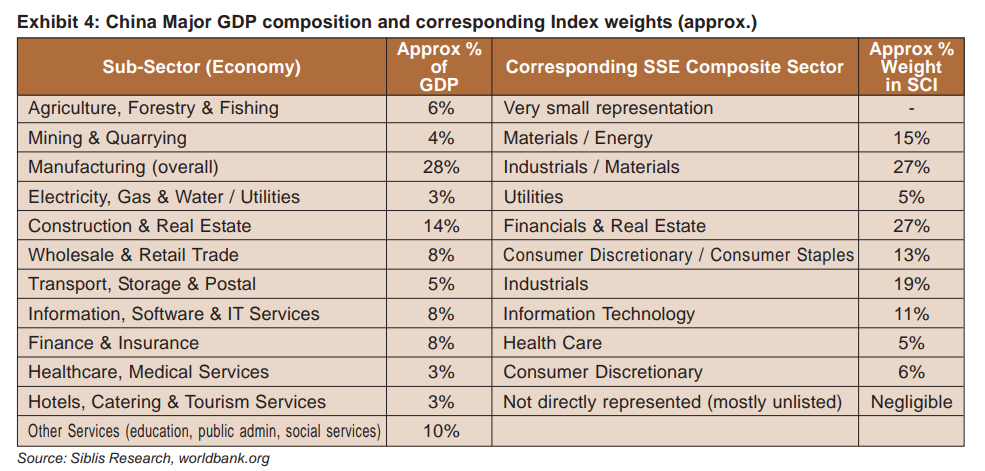
Financials & Real Estate dominate the stock index, far exceeding their direct GDP share, because of Stage Owned Enterprise Banks and large real-estate firms. (Exhibit 4)
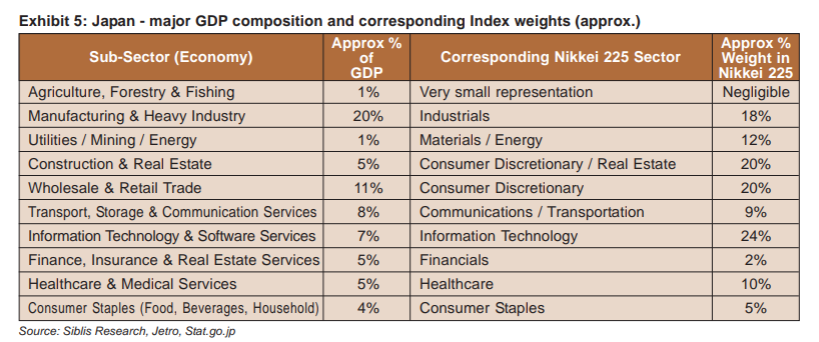
The Japanese Index clear is heavy on consumer discretionary and Real Estate compared to its weight in the GDP.
Every economy has important contributors that don’t show up in the stock index, and this isn’t unique to India. The US shows a similar disconnect. A massive share of the economy comes from healthcare, education, government services, and small businesses- sectors that are either only partially represented or not represented at all in the S&P 500. China’s GDP is driven meaningfully by manufacturing, exports, and a vast network of SMEs, many of which are either state-owned, unlisted, or thinly traded. As a result, the listed universe skews heavily toward financials and real estate, giving a far narrower picture than the broader economy. In Japan as well, large parts of the economy from traditional manufacturing clusters to region-specific industries and countless mid-sized exporters — don’t fully reflect in the index.
So far, what we have clearly established is that the GDP construct of a country is a very broad establishment of which Index is an important- but not the only part. Therefore, GDP composition is NOT equal to Index Composition and hence the growth equation between them may not always be liner.
Now, also let’s look at how different the construct of each country’s Index is. Yes, they have the same sectors (IT, Finance, Energy, FMCG etc) but the weightage of each of those sectors is very different for each country. For instance, India is heavy on financials, the US on the other hand heavy on IT, China is heavy on real estate. That’s because an index is ultimately the best representation of a country’s listed companies, not its entire economy. And what gets listed, what attracts capital, and what scales into large public corporations differs meaningfully across countries.
The broth may be the same — sectors like IT, finance, energy — but the proportions differ dramatically across countries, just like our four bowls of Khow Suey.
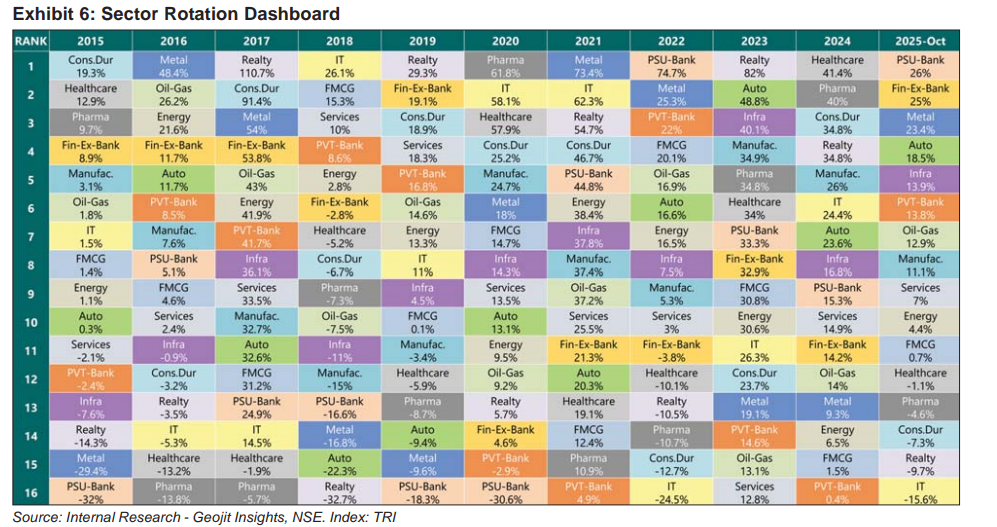
So, if GDP isn’t the sole driver, what does make the index move? In our experience, it’s a cocktail of sector-specific tailwinds, earnings growth, liquidity, reforms, and most importantly valuation discipline. Over the long term this turns out to be extremely crucial when establishing long-term returns for investors. Sector rotations keep happening and it is our job to know when to be cautious in certain sectors and when to be aggressive.
Afterthoughts
Yes, the opening — the rain, the concert, the Khow Suey — took its time. But some ideas land better as stories than as spreadsheets. If this one sticks because of coconut broth and chilli oil, we’ll take it.
The investor we met eventually tapered down his expectations once we walked him through the data. He wasn’t thrilled to see his thesis challenged, but he did appreciate that the counterview came with context, evidence, and a fair bit of nuance.
Incidentally, that evening also happened to be the day India was playing Australia in the Women’s World Cup semi-final; a match we eventually won.
That night wasn’t just about the Khow Suey. It was the rain, the concert, the appetisers, the drinks — and the victory. Just as the joy in markets isn’t only about index growth, but the broader economic rhythm that drives it. With India winning the finals as well, the victory felt even sweeter- much like the rising cadence of our own GDP numbers. Bailamos to that.