

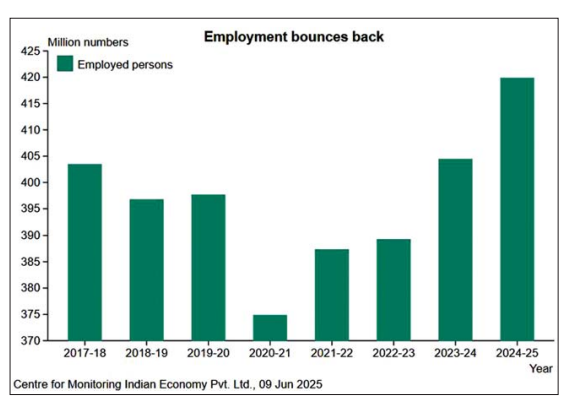
Employment grew handsomely in India during the past two fiscal years – the year ended in March 2024, and the one ended in March 2025. In both the years, the growth in employment was more than twice the estimated growth in the working age population. While the working age population is estimated to have grown at about 1.9 percent per annum during these years, employment grew by over 3.8 percent per annum in both years.
Over 15 million jobs were added during each of the two years, 2023-24 and 2024-25. This is a big increase in a normal year. Even in the Covid-recovery year of 2021-22, India added just 12.5 million jobs after losing 22.8 million jobs during 2020-21.
Cumulatively, in the recent two years, India added 30.6 million jobs. The working age population is estimated to have grown by about 41.4 million during this period.
Interestingly, while employment grew handsomely, unemployment also increased. India added 5 million to the count of people who were willing to be employed and were actively looking for employment but were unable to find jobs in the recent two years.
Jobs fell very sharply during the Covid-quarter of June 2020. The recovery in the following quarter was not complete and, it remained incomplete till early 2023. Since then, jobs have recovered steadily.
The job additions during these two years are qualitatively desirable as well.
Most of the jobs have been added in urban India. Urban India accounts for 36 percent of the working age population. In 2023-24, a much larger proportion 48 percent – of the additional jobs were created in urban India. But, in 2024-25, an even larger, 65 percent of the additional jobs were in urban India. Urban jobs are better paying than rural jobs and therefore this greater proportion of new urban jobs suggests that the quality of jobs generated in recent years has been of the more desirable kind.
Women have had a very small share in total employment in India. Before the Covid shock, women accounted for only 11 percent of total employment. Then it fell below ten percent. As employment started improving in the recent two years, the share of women in employment rose. In fact, on the margin, female employment played a much more important role in the recovery than its share in employment would have warranted.
In 2023-24, while females accounted for less than 11 percent of total employment they accounted for 51.5 percent of the increase in total employment during the year. 7.8 million of the 15.2 million additional jobs created in the year were of women. In 2024-25, the share of female employment in total additional employment fell to 32.5 percent. But even this is nearly thrice the share of women in total employment. Of the 15.4 million jobs created during the year, 5 million were of women.
This resurgence of female employment is disproportionately located in urban areas. 48 percent of the total additional women employed in 2023-24 and 60 percent of the total additional women employed in 2024-25 were in urban regions. This is not employment from the rural employment guarantee scheme, MGNREGA which is temporary and a sign of distress. These are urban jobs.
The better-quality jobs of 2023-24 and 2024-25 is also evident from the simple fact that over these two years, employment in agriculture shrunk and that in non-agricultural sectors rose. Labour moved out of agriculture in a big way earlier in 2022-23. Fiscal 2023-24 and 2024-25 consolidated this migration out of agriculture.
Nearly 11 million jobs moved out of agriculture in 2022-23. Less than a million went back in 2023-24 and then in 2024-25, another 2.3 million moved out of agriculture. In stark contrast, non-agriculture employment increased by 12.8 million in 2022-23, by 14.4 million in 2023-24 and by another 17.7 million in 2024-25. Total non-agriculture employed galloped from 238 million in 2021-22 to 283 million in 2024-25.
In general, agriculture jobs pay less than non-agriculture jobs and therefore this migration out of agriculture is a desirable change.
The nature-of-occupation classification of jobs also indicates that the increase in employment is in the relatively better types of occupation. There are four major classifications of the nature of occupation. These are business, salaried employment, small traders and daily wage labourers, and farmers. Of this salaried employment is the most desirable type of employment. This is followed by business, farmers and small traders and daily wage labourers.
In 2023-24, over 43 percent of the additional employment was in salaried jobs. Another 31.4 percent was in business. Nearly three-fourths of the additional employment was therefore in the most desirable types of occupations. In 2024-25, nearly 52 percent of the additional employment was in salaried jobs, and another 46.7 percent was in business. Over 98 percent of the additional jobs were of the desirable type.