


Harshad Patwardhan, Chief Investment Officer, Union AMC
No need to panic
Market corrections and volatility are part and parcel of investing in equities. While most investors know this in theory, a sharp downturn often triggers anxiety and short-term thinking. When emotions take over, many investors shift their focus from sound principles to unproductive guesswork about the unknowable — such as predicting the exact bottom. It is during such phases that revisiting key lessons from past corrections and recoveries becomes crucial.
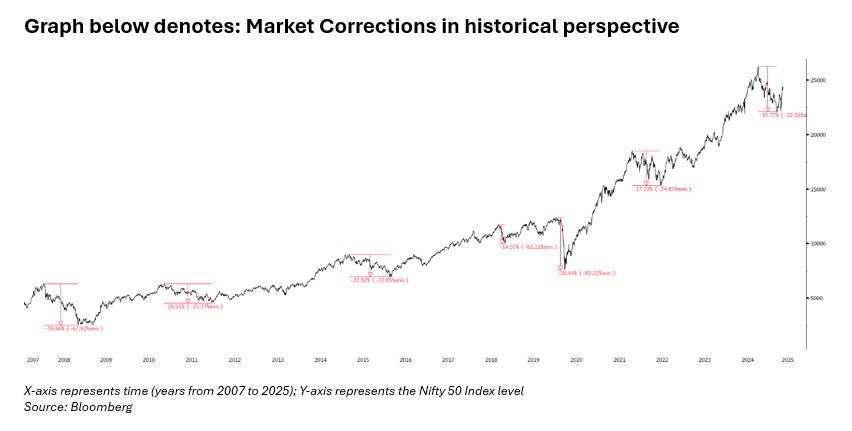
Corrections are natural
Over the last 18 years, there have been multiple episodes where the Nifty has corrected by more than 15% — seven such phases, to be precise. These corrections varied in length, depth, and cause. The most severe drop was in 2008 when the index fell over 60%, while the briefest correction occurred in early 2020 and was over in just a couple of months. The recent correction of ~16% from its peak reinforces the point — while these events may feel unsettling, they are hardly unusual.
Importantly, it is nearly impossible to time the beginning and end of a correction. Attempting to do so often leads to frustration rather than better outcomes.
Index vs. individual stocks: The hidden story
While indices like the Nifty or Sensex often dominate headlines, they do not tell the full story. Under the surface, there is always a significant gap in the performance of individual stocks — even in years when indices are flat or down.
Take 2024, for example: NSE500 was up 15%, but the top 25 stocks delivered a staggering average return of 155%, while the bottom 25 fell by 36%. A similar story unfolded in 2018, when the index was down 3%, yet the best-performing stocks rose over 50%, and the worst dropped more than 70%.
This wide dispersion underscores the need to look beyond index movements and understand where market leadership is shifting.
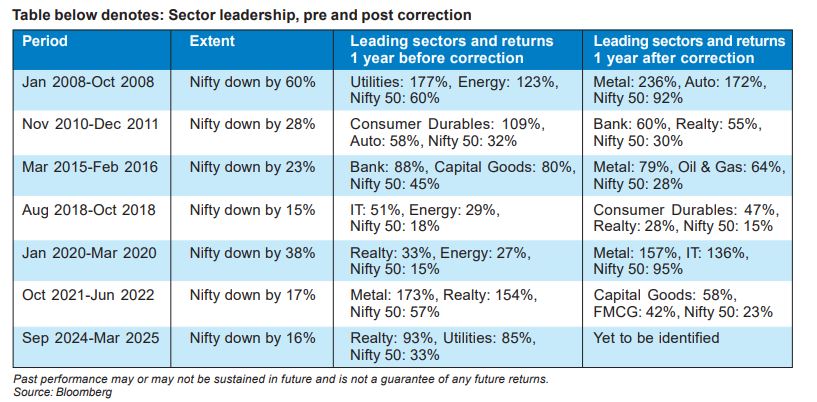
Sectoral leadership shifts: A key insight
History shows that the sectors leading the market before a correction are rarely the same as those that outperform in the recovery. The table below captures this well — note how different the post-correction winners are from the pre-correction leaders across various cycles:
What should investors do?
Corrections, though uncomfortable, often offer opportunities for disciplined investors. Since the timing and duration of such phases cannot be forecasted reliably, the approach could be to stay invested systematically.
Crucially, post-correction periods have historically delivered strong 12-month returns. This is when market leadership often changes, and fresh winners emerge. By staying the course — and aligning portfolios with strategies that may adapt to sector rotation — investors give themselves a better shot at long-term outperformance.
Source: Bloomberg
Author is Chief Investment Officer, Union AMC